In the world of sports, a ‘win rate’ is a common way to compare teams or coaches over different periods. For instance, one could compare Rassie Erasmus’ coaching tenure to Heyneke Meyer’s, or the Springboks to the All Blacks, by looking at their respective win rates – a simple calculation that expresses wins as a percentage of matches played.
In the world of investments, we use a similar but more nuanced metric to measure outperformance over specific timeframes.
To gauge relative performance, a useful metric is ‘rolling returns’, which takes into account investment windows within longer timeframes.
For example, over a 10-year period, Fund X beat its benchmark 45 times out of 60 possible five-year investment windows – from inception to current– implying a win rate of 75%.
Enter the investment relevance of a win rate percentage. Over the past few years, there has been an emerging narrative that ‘Cash is king’. Comments such as, “I would have been better off in cash,” have echoed around investment conferences, both physical and digital.
While this is certainly not based on like-for-like comparisons – comparing returns from cash against equity or high-equity multi-asset strategies is like comparing the All Blacks rugby team to the Proteas cricket team – this is not uncommon, with many investors arguing that they have taken on risk without benefiting from a significant improvement in returns.
But when assessing the ‘Cash is king’ narrative, I would like to propose that we look at win rates as opposed to very specific time periods.
Specific time comparisons can be problematic as they promote investor biases, with investors often losing sight of the bigger picture.
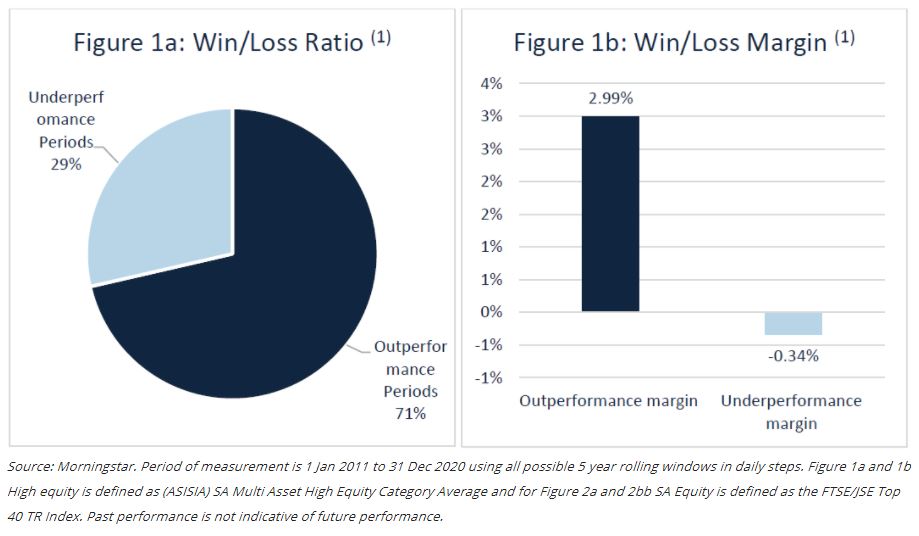
To illustrate this, let’s look at the (ASISA) Multi-Asset High Equity category (1), which is typically measured over a five-year time horizon and has fallen victim to the ‘Cash is king’ narrative. But when we look at the past 10 years through the lens of a win rate, we see a very different picture.
Figure 1a, below, shows that if we consider every investable five-year window over the past 10 years, high-equity has outperformed cash 71% of the time, and when it does outperform, it does so with a wide margin – an average of 2.99% outperformance.
On the other hand, the margin of underperformance is a far more modest -0.34%. I would certainly rather put my money on the team that wins 71% of the time, and that tends to win by a large points difference!
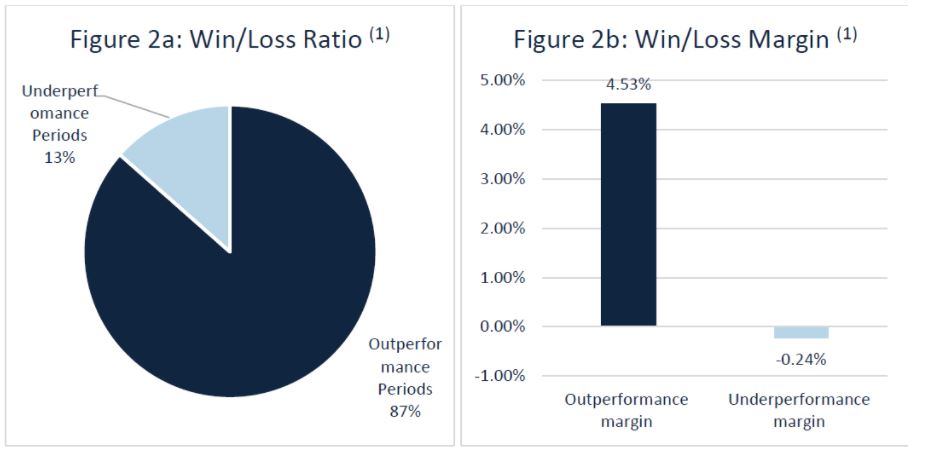
Similarly, if we consider every investable five-year window over the past 10 years, the FTSE/JSE Top 40 index has outperformed cash 87% of the time, and when it does outperform, it does so convincingly.
Its margin of outperformance averages 4.53%, versus a margin of underperformance of -0.24%.
When looking at the above win/loss ratios, it is difficult to comprehend why the narrative in favour of cash has gained so much traction. Why did so many investors feel that they would have been better off in cash?
This can be partly explained by two behavioral biases – loss aversion and recency bias. Loss aversion describes the fact that the pain of losing is psychologically far more powerful when compared to the satisfaction of winning, or gaining.
Essentially, the fear of losing one’s money – or a client’s – leads to bad decision making (ignoring these win rates). In addition to this, recency bias shows why investors favour recent events over historic ones by giving greater importance to them.
This is evident in the high rate of new cash investments that follows a period of outperformance by cash. Or the belief that Rassie has a better win rate than Heyneke shortly after Siya Kolisi has raised the Web Ellis Cup.
We would encourage investors to look at win rates over appropriate time horizons, to match their investment decisions to their investment goals, and to dial down the noise in the short term.
In addition, by understanding the potential for both out- and underperformance, we can set expectations from the outset, and not panic when cash is indeed king, which it rarely is.
Lastly, and at the risk of contradicting the points made in this article, CoreShares supports the Springboks at all times, regardless of the coach or the All Blacks win rate.
-
Source: Morningstar. Period of measurement is 1 Jan 2011 to 31 Dec 2020 using all possible 5 year rolling windows in daily steps. Figure 1a and 1b High equity is defined as (ASISIA) SA Multi Asset High Equity Category Average and for Figure 2a and 2bb SA Equity is defined as the FTSE/JSE Top 40 TR Index. Past performance is not indicative of future performance.